What are technical indicators?
What are technical indicators?
Technical metrics are mathematical patterns derived from historical data that technology users use to predict future price trends and make transaction decisions. Use mathematical formulas to derive a set of data points from historical price, volume, and open interest data.
What are the most popular and useful indicators?
There are many indicators in traditional finance, but the most popular indicators are.
- Bollinger band
- MACD
- RSI
What is a Bollinger band?
Bollinger Band is one of the most commonly used trading indicators by market operators to compare the relative value of the price with changes in asset prices over a period of time.
The metric consists of three bands created by John Bollinger in the 1980s and drawn superimposed on the price evolution chart.
- The center band is the moving average. Typically, a simple moving average (SMA) calculated over 20 periods is used, indicating the evolution of the last 20 period means over time.
- The upper limit is calculated by adding twice the standard deviation of the moving average line to the simple moving average value.
- The lower limit is calculated by subtracting twice the standard deviation of the moving average from the simple moving average.
Standard deviations are statistical parameters that represent changes in market value because they take the variation in the values that make up the mean. For example, the period of 9 and the other period of 11 provide an average of 10 ((9 + 11) / 2 = 10), and the mean has a standard deviation of 1. Mean between 1 and 19: the mean is again 10 (1 + 19) / 2 = 10), but the standard deviation is 9.
Therefore, this parameter can be used to calculate bands to quickly respond to price fluctuations by reflecting periods of high and low variability. Similarly, the bands between the upper and lower bands cover nearly 90% of the statistically possible price fluctuations. This means that price fluctuations outside the band are very rare and therefore particularly important.
For this reason, the Bollinger band is used for the following purposes.
- Identify periods of high or low volatility.
- Identify the trend change in price.
- Identify the strengths or weaknesses of the price trend.
One of the most commonly used cases in this band is to define a potential break trend using it as a volatility indicator. If the price is in range, the band is squeezed. If this situation continues for a while, the more time the band spends together, the stronger the intensity of the breakup will be.
How to trade using this band?
Users typically use the Bollinger band in two ways.
The first is to follow the trend. If the price is within range, if the price is outside of one of the sides, you place an order and follow the trend. We also need to set up profit-taking and loss-making. Losses are settled in other bands (not broken bands) and profit-realization orders can be adjusted the same as loss sales, but can be adjusted on the opposite side.
This can be explained better with real examples.
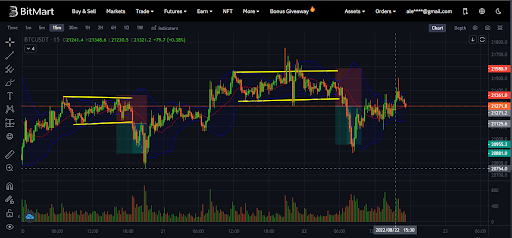
Two ranges can be observed in BitMart's 15M BTC USDT chart. If the price falls below the lower limit, the user must pull the trigger and enter the short position in BitMart Futures. Set the loss sale (SL) over the top band and set profit realization at the same distance. So you can see that both of them are successful. This is a basic strategy and is easy to use.
This strategy is available for all periods, but is typically used in M5 or M15 charts.
The second case is easy, but it's against the trend. The user should be a little more aware of candlestick patterns, especially the return pattern. Therefore, the Long Opportunity is the beginning of the setting, so the user should focus on finding the inverted pattern using the candlestick.
If the user finds a potential inverted candle, they must wait for confirmation. The confirmation is above the last candle maximum (Long) or below the last candle minimum (Short). Losses must be settled below the inverted candlestick pattern (long) or above the inverted candlestick pattern (short). Profit Realization Orders should be settled around the middle brand. Users need to assess the risk to determine whether the opportunity is good or not. They can use a tool called Short Position or Long Position on BitMart charts.
So let me focus on this example.
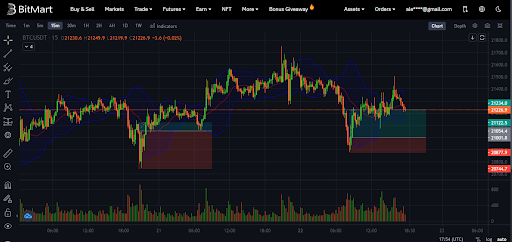
This is BitMart's 15M BTC/USDT chart. In the first case, it's not good to get drunk because of the setup, there's a break in the band, and there's an inverted candlestick pattern (a pattern that swallows almost finished candles), but the risk/benefit ratio is not good because the sell-off is bigger than the take. Profit. Successful, but good to leave it at that.
The second one is perfect. A perfect reversal pattern appears after the price falls below the band. The risk/benefit ratio is pretty good. The user must use Long in BitMart to pull the trigger and set up TP and SL. This transaction was successful.
What is MACD?
The moving average convergence/sparkling (MACD) is the moving average of convergence/sparkling following the trend created by Gerald Appel. A momentum indicator that captures trends and shows the relationship between two moving averages of prices.
MACD consists of the following components by default.
MACD value = (EMA 12 cycles - EMA 26 cycles)
Signal Line = MA 9 from above calculation
MACD histogram = (MACD value - signal line). The distance between the lines.
How can I trade with MACD?
There are two practical ways to trade with this indicator.
Open the position when the MACD line crosses the signal and close the position when the first line crosses the other line. This is a trade signal.
When both lines cross above the zero level, the transaction is initiated, and when both lines cross down, the transaction is terminated.
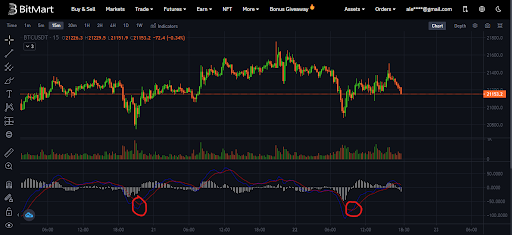
Users don't think of MACD as a strategy in itself, it's like checking. Used to determine items due to branching or trade signals. Trading is common when MACD has a divergence or transaction signal and the price is in support (long) or resistance (short).
What are the RSI indicators?
The RSI indicator is one of the most commonly used indicators in technical analysis. Despite its simplicity, it is a key indicator of the transaction because it allows you to evaluate the strength of price fluctuations for all assets listed on the market.
The RSI represents the relative strength index. As its name implies, the RSI measures the momentum of change in asset prices to assess whether the price of that asset has been oversold or overbought.
The RSI is a technical indicator in the oscillator category. This means that the value is between 0 and 100, so it is graphically represented by a continuous line moving within that interval. The RSI was created in 1978 by J. Wells Wilder Jr. and has been widely used and widely used since.
The RSI measures how good the price of an asset is on its own. This translates into measuring whether an asset is overvalued or undervalued for practical purposes.
- An RSI reading of 70 or higher is considered to indicate that the asset is overbought or overvalued. Therefore, if the RSI exceeds 70, adjustable price movements can be expected.
- On the contrary, RSI numbers below 30 indicate that assets are oversold or undervalued, so this level of RSI may indicate a bullish price response.
How to use RSI?
As shown, the RSI is one of the most used indicators in transactions. This is due to the amount of information that can be provided to users who use technical analysis to define a transaction.
This section describes how to optimize transaction results using RSI. To do this, you will see how to use the RSI to.
- Identify price trends.
- Receive a transaction signal.
To understand trends with RSI, users should pay attention to indicators. If the RSI shows a higher low, it means that prices are on an upward trend. If the RSI shows a lower high, it means that prices are on a downward trend.
Like MACD, users do not use RSI as a strategy itself. If divergence occurs, it means that there is a possibility of reversal. The RSI is a confirmation of pulling the trigger and is usually combined with price action. If divergence occurs in the RSI, the RSI shows a higher low, but the price is lower and the price may be in the potential support area, so it's a good chance to take a long position in the futures setting. Losses below the support line and profit realization near the resistance.
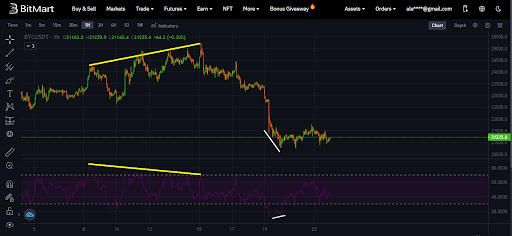
This is BitMart's 1H BTC/USDT chart. Prices in the first case (yellow) are showing higher highs, but the RSI indicator is showing higher lows. This means that there is a divergence and the price is in the resistance area. , This was a great opportunity to take a short position.
In the second case (white), the user can see the divergence because the price is lower and the RSI shows a higher low. In other words, the user sets a loss sale below the low point and resistance to realizing profits.
Limitation of Liability
Cryptocurrency Is Exposed to High Market Risks and Volatility Despite Its High Growth Potential. It is strongly recommended that users investigate and invest at their own risk. BitMart will do its best to list only high-quality coins, but will not be responsible for any investment losses.
All content produced by BitMart is for educational purposes only. This should not be taken as financial or investment advice.